We’re sure it won’t come as surprise to any of you paying attention to the housing market that prices have gone up again. The average home price across Simcoe County for January was nearly $1 million! Low inventory and high migration continue to drive pricing up, which is a boon for Sellers, but is making the purchasing process for Buyers a frustrating one.
If you want to pick our brains about Buying or Selling tactics in this crazy market, reach out for a no-obligation call. We are happy to chat. Reach out to us HERE
Simcoe County Monthly Residential Report January 2022
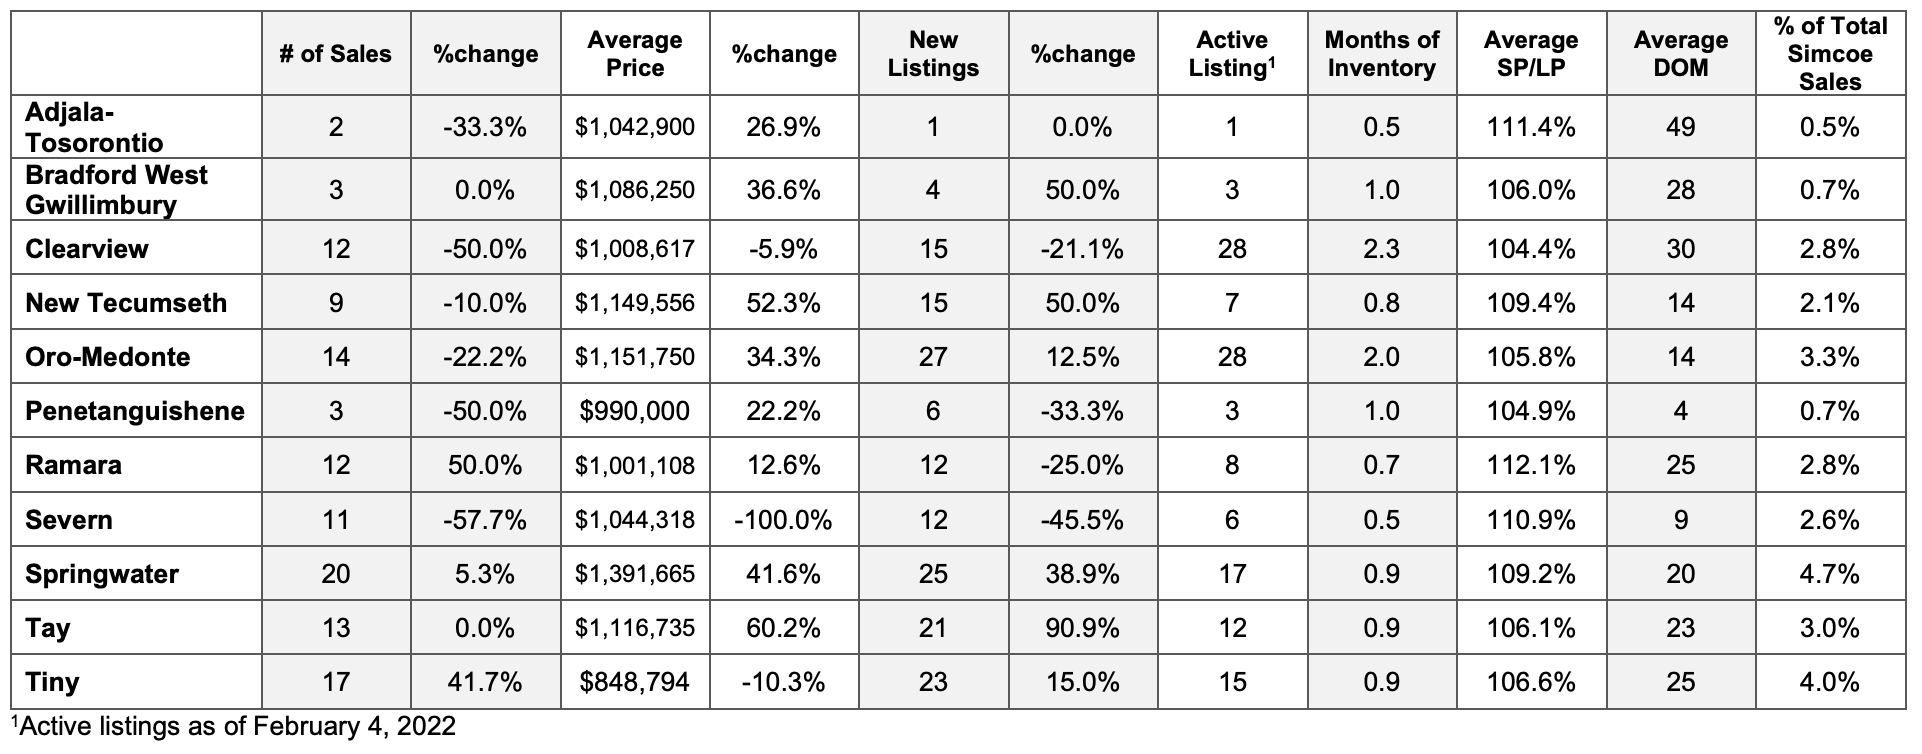
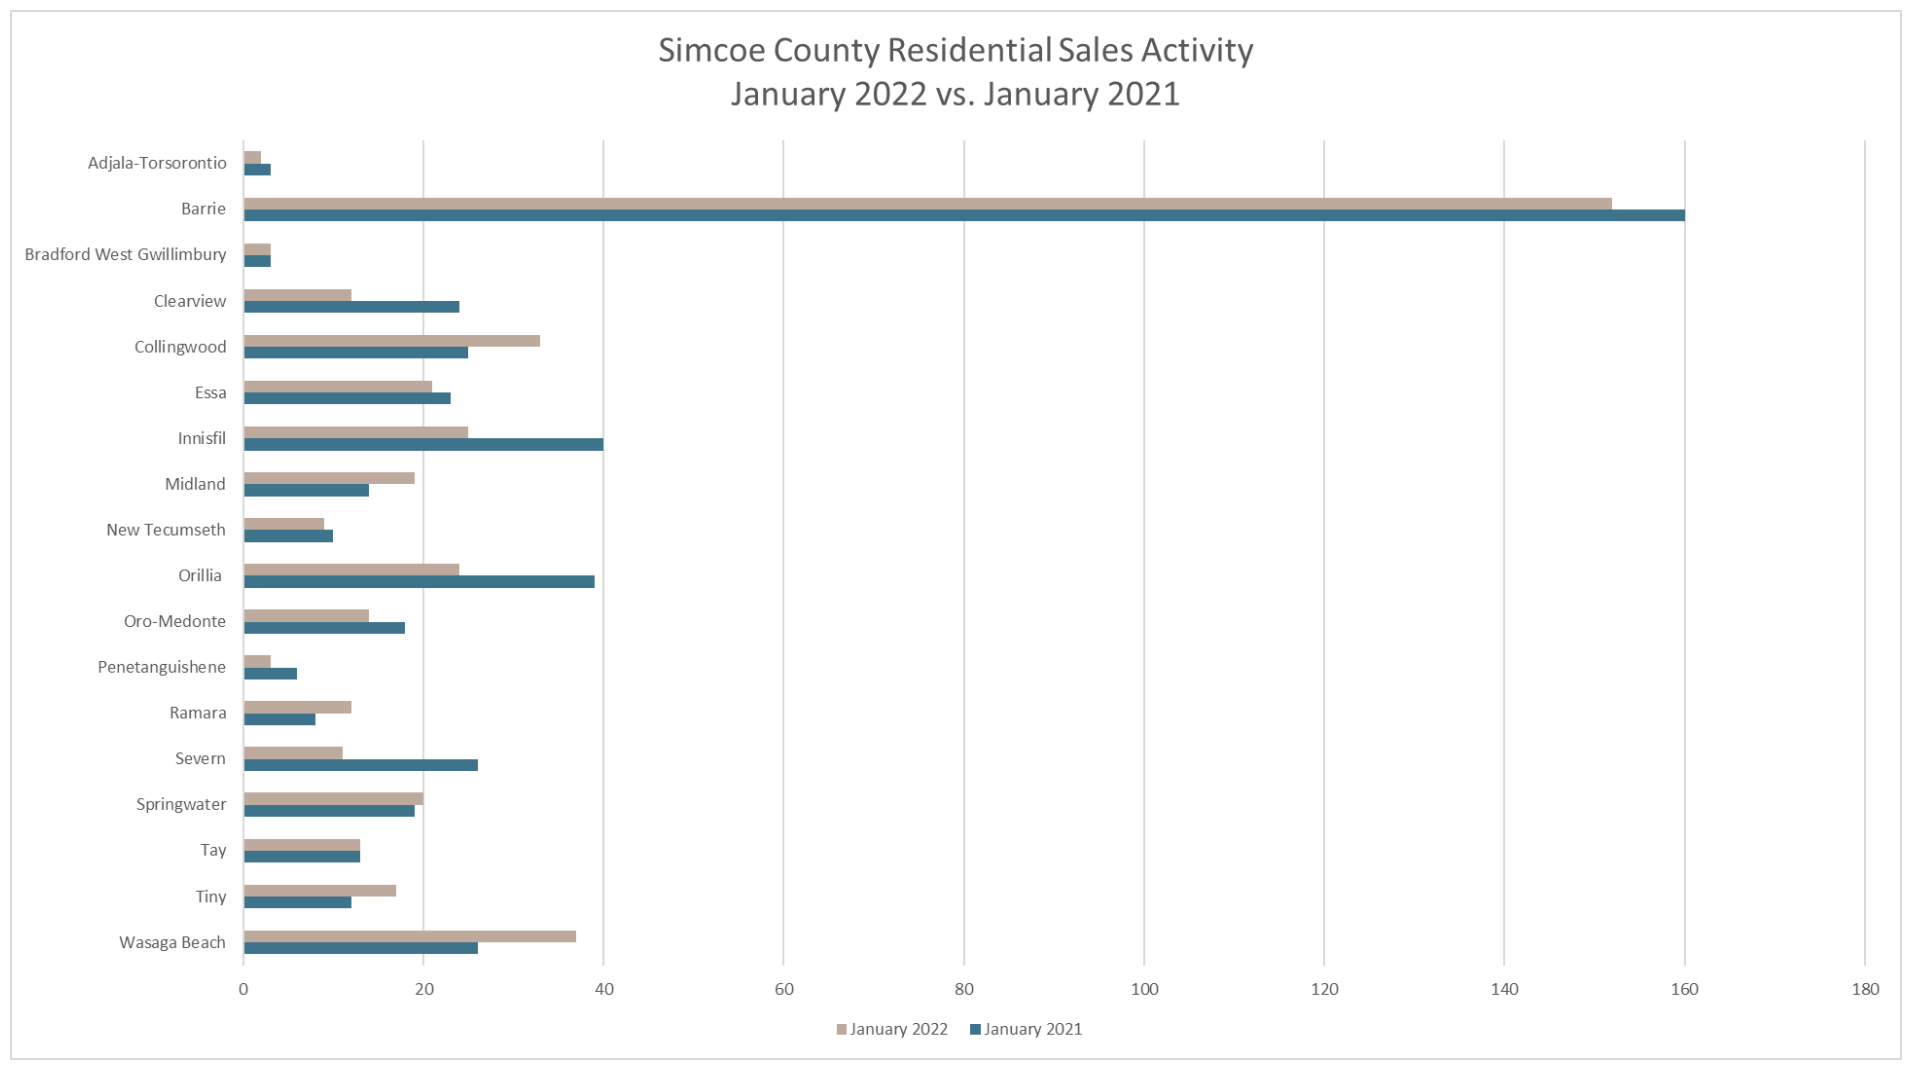
Year-Over-Year Summary The January 2022 sales information is in, and residential property sales recorded through the MLS® System for the Barrie and District Association of REALTORS® (BDAR) region showed an overall year-over-year decrease in the number of units sold, a slight increase in new listings, and a large increase in average sale price.
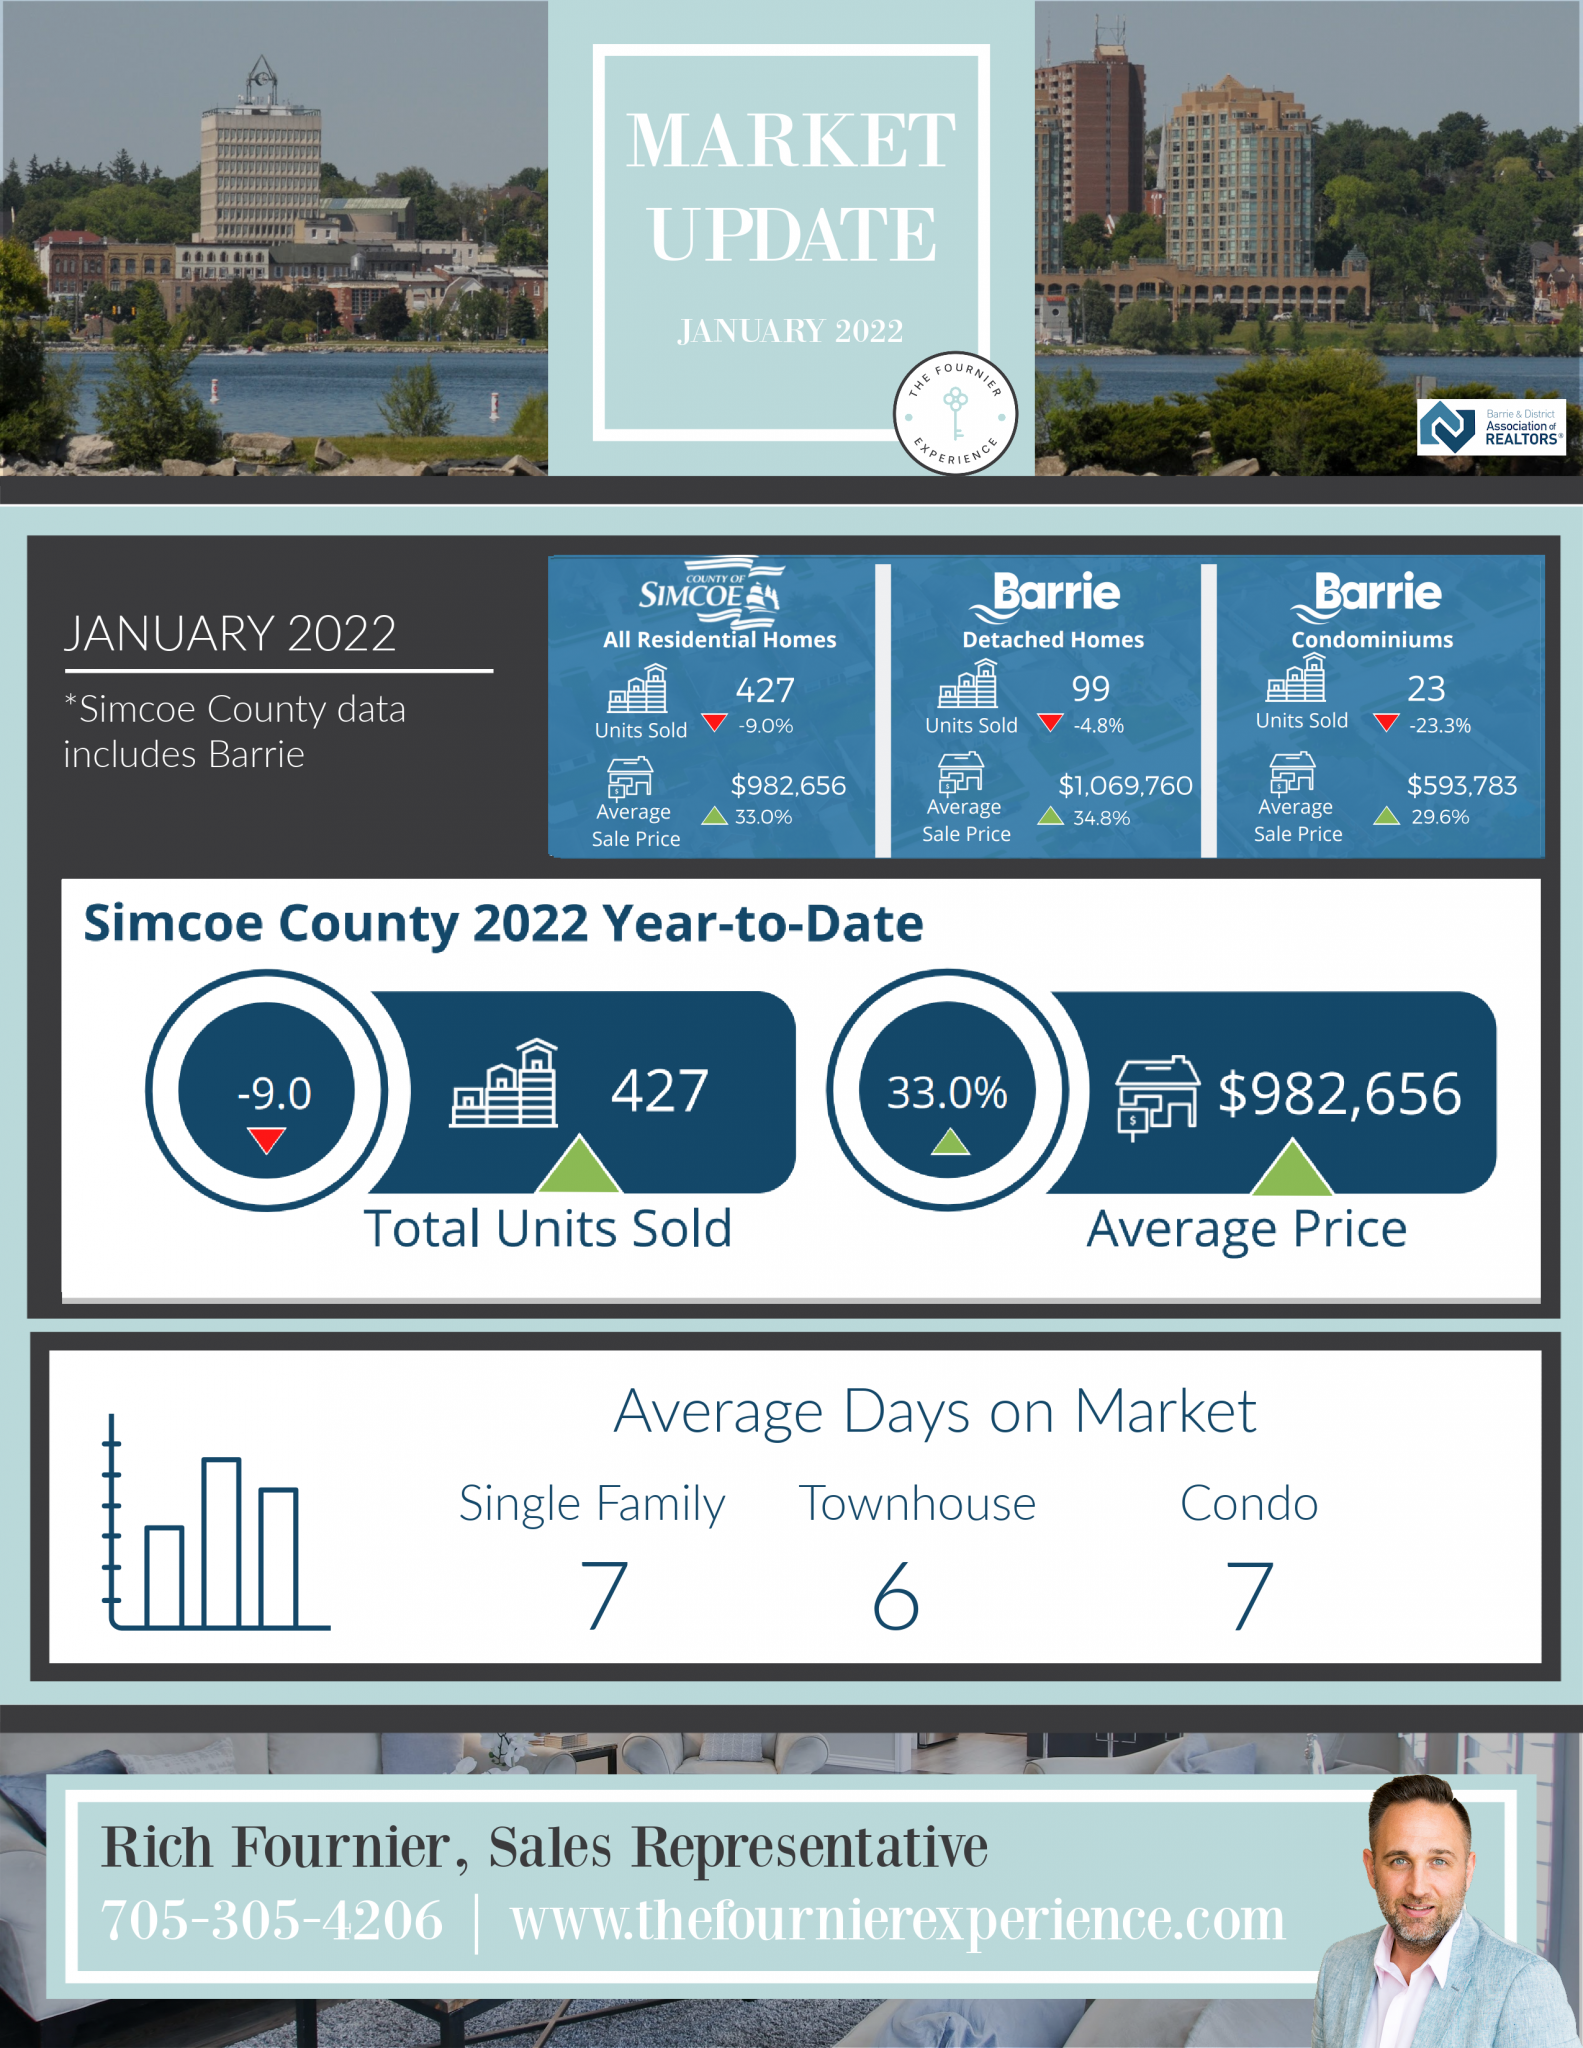
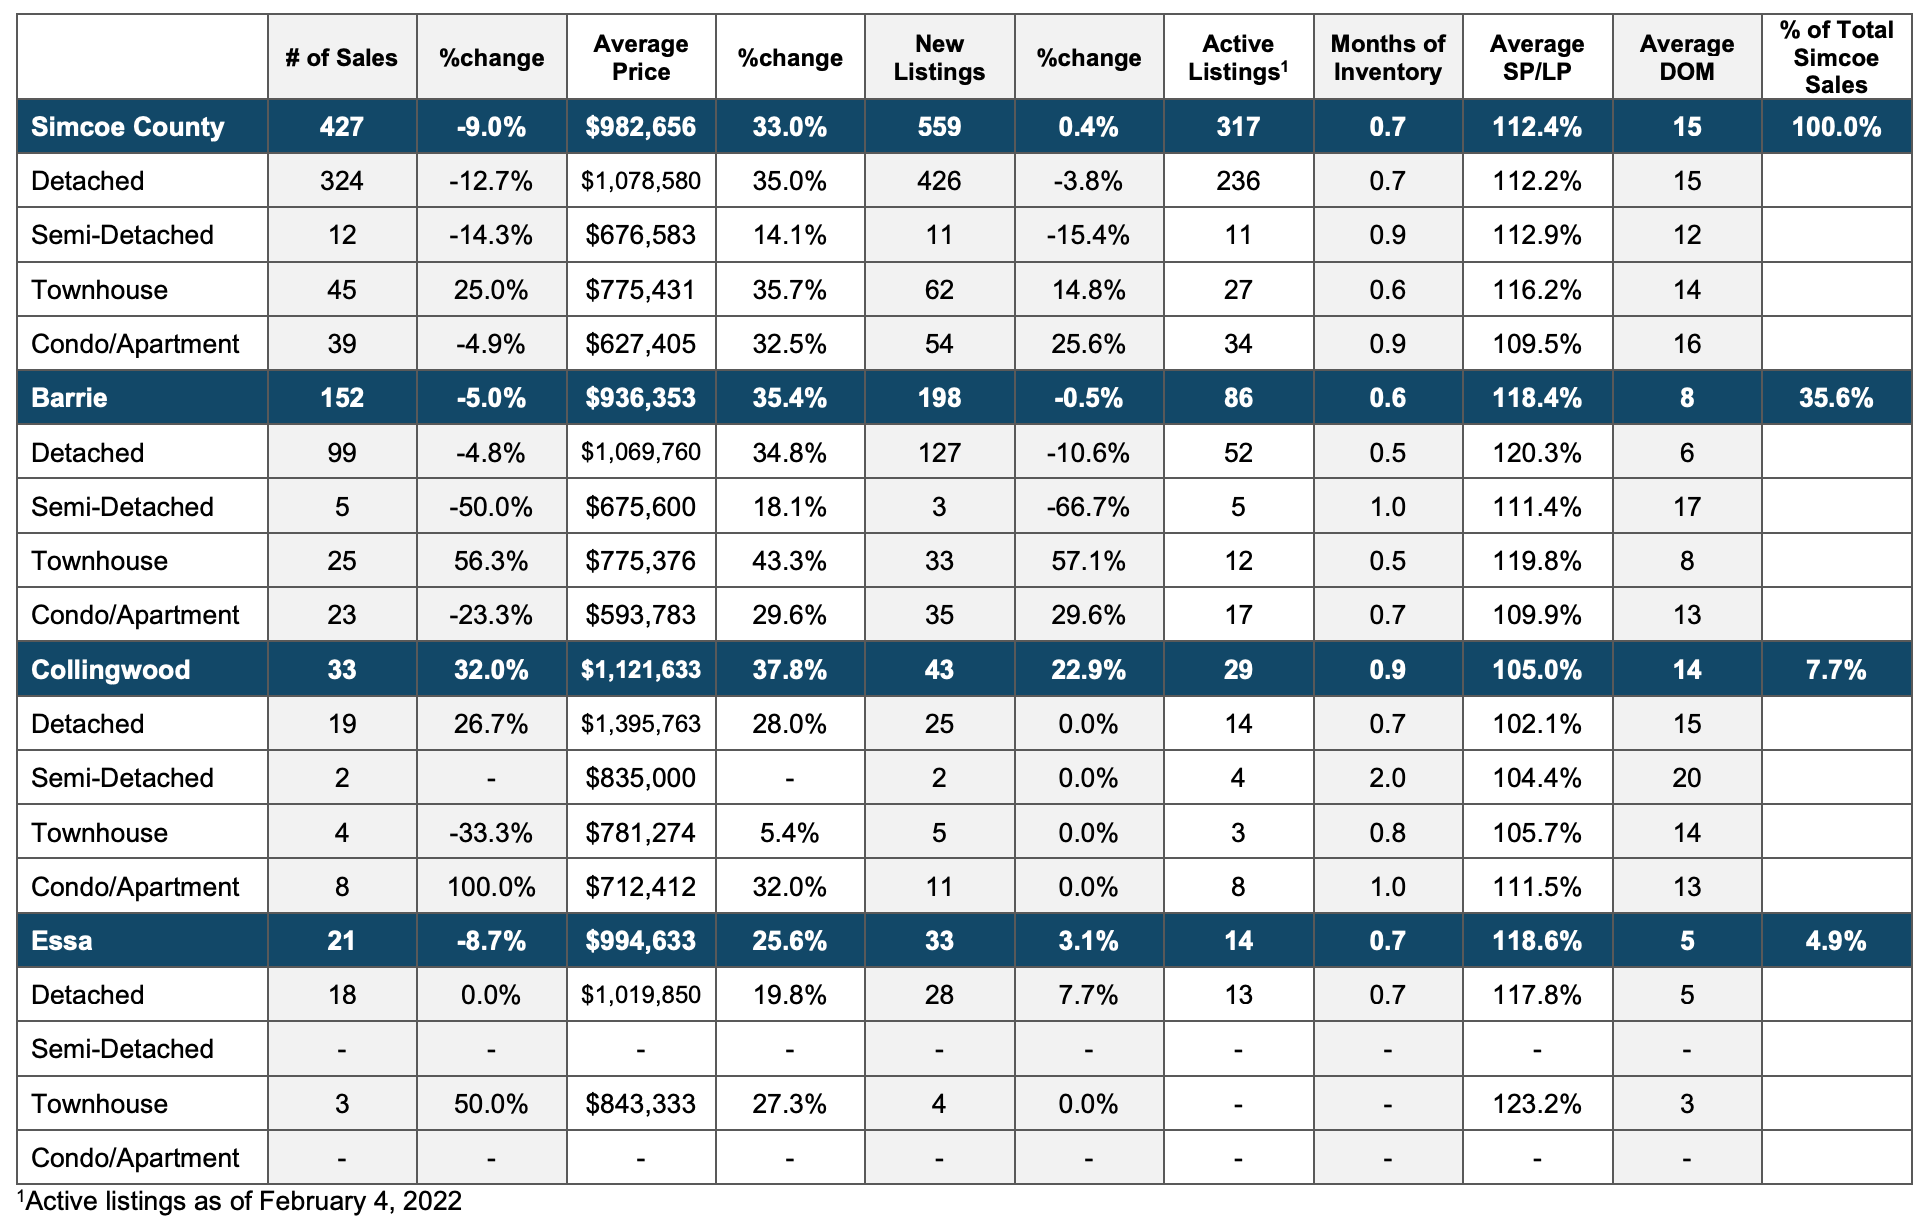
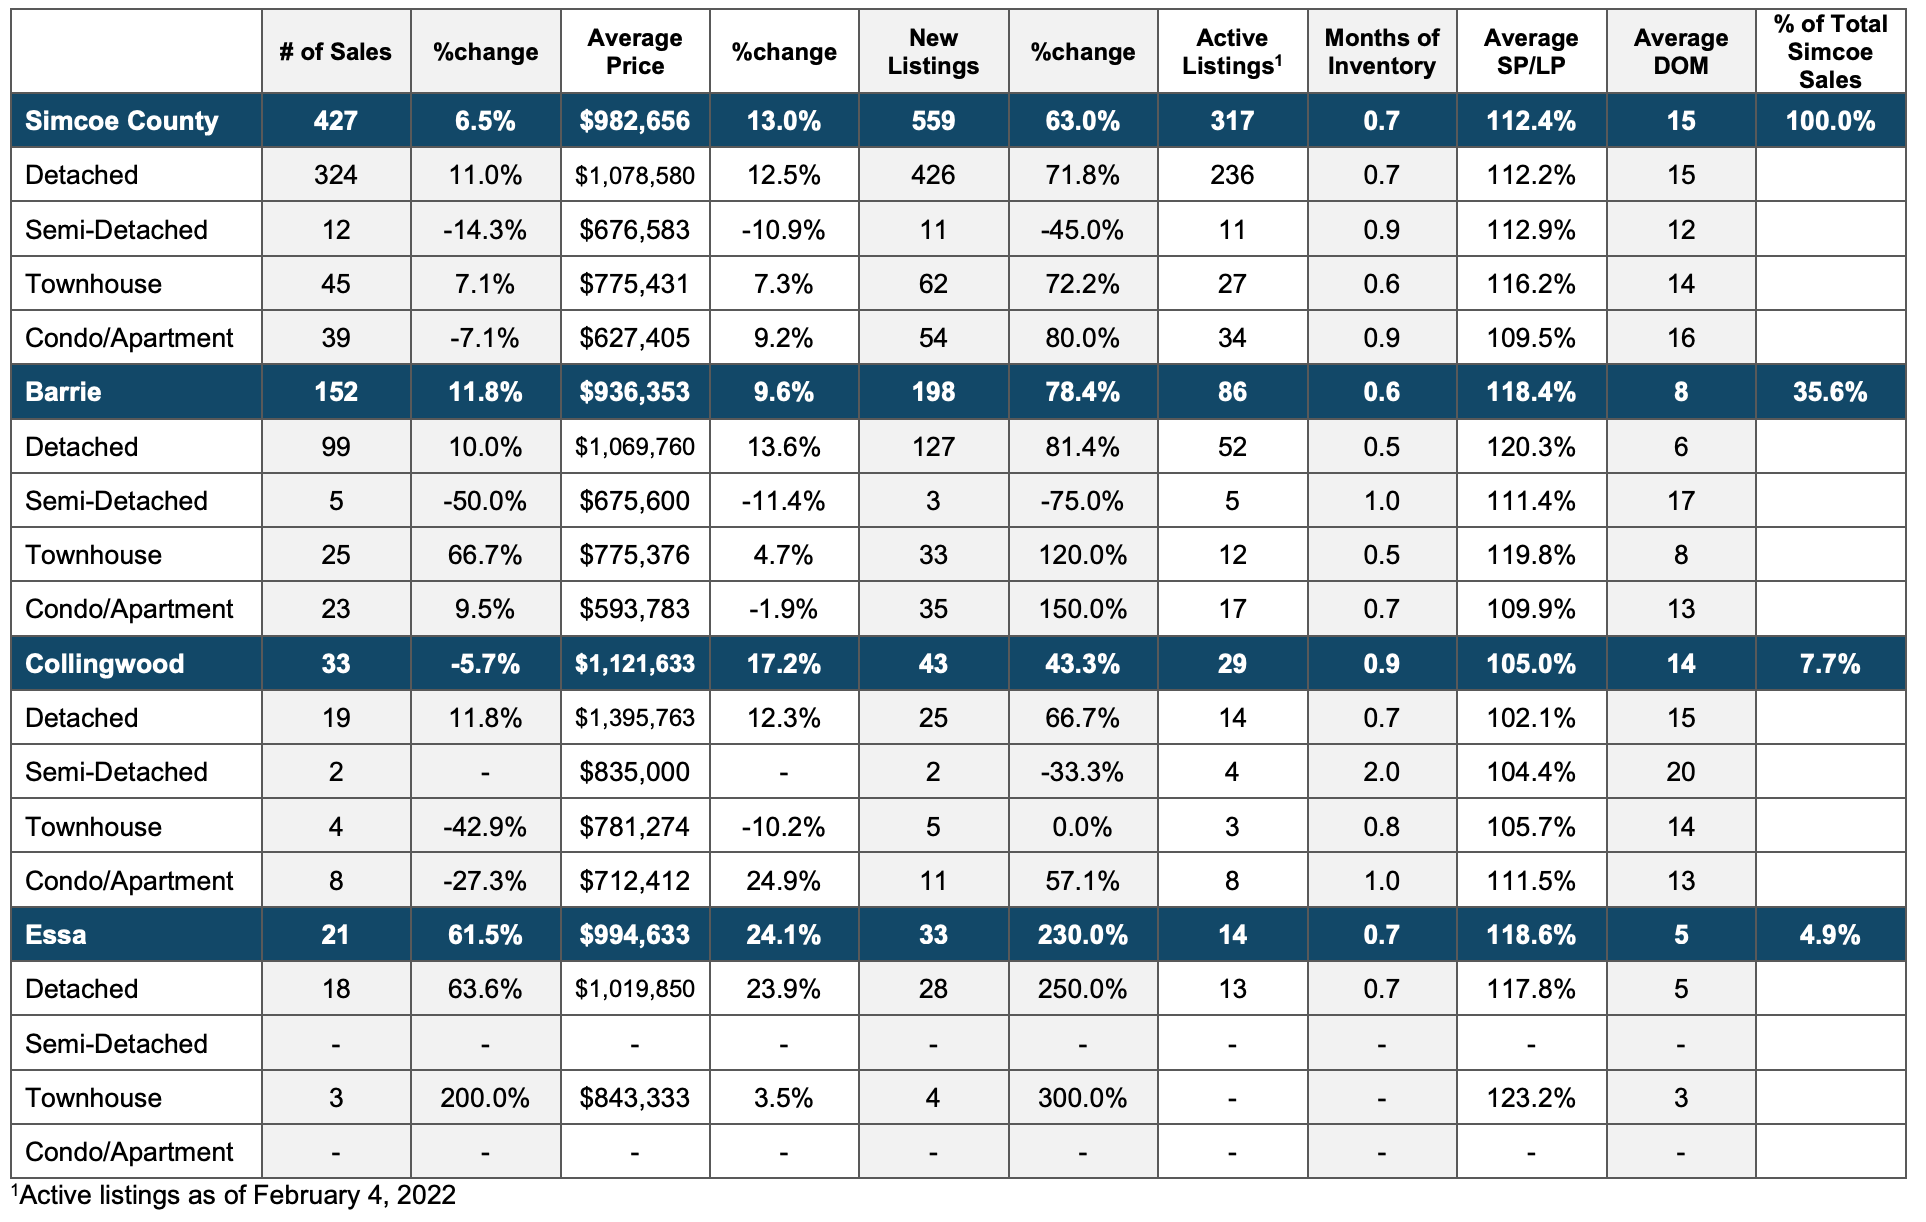
427 units were sold this month in Simcoe County, that’s 9.0% less than the same time last year. The average price of residential units sold was $982,656, which was 33.0% greater than that of January 2021.
152 residential units were sold during January 2022 within Barrie. This was 5.0% less than the number of units sold during January 2021. This decline was lesser than that of total Simcoe County (-9.0%).
The average price of residential Barrie units sold during January 2022 was $936,353—35.4% greater than the average price of units sold during January 2021. Sales in Barrie accounted for 35.6% of residential sales in Simcoe County last month.
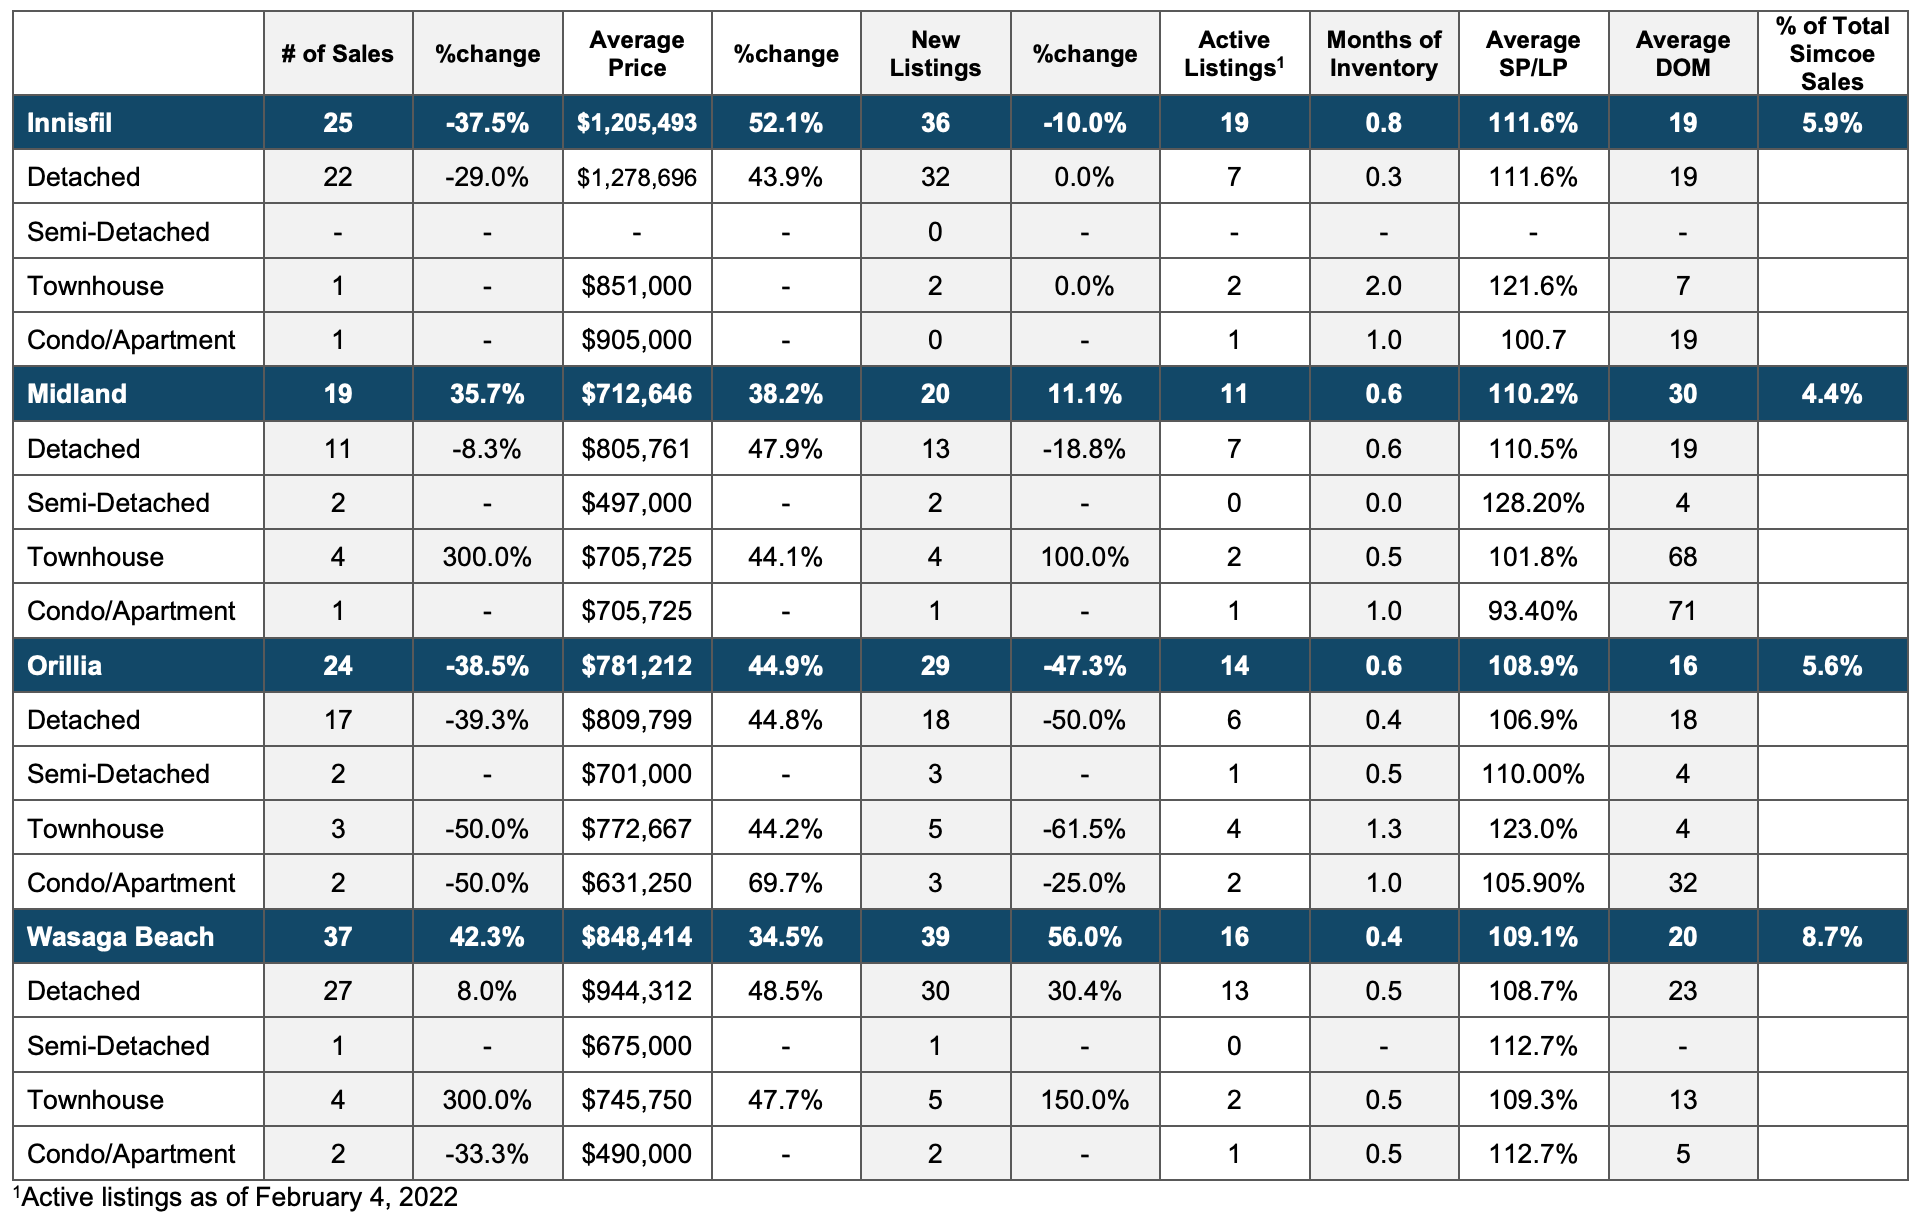
There was an overall increase in new listings during the month of January which prevents a further decline in overall inventory. However, active listings remain low with just over 300 units for the whole region. The demand for the Simcoe County region remains strong, overall inventories remain low and with that, prices continue to rise.
Year-Over-Year January 2022 vs. January 2021
Year-Over-Year January 2022 vs. January 2021
Year-Over-Year January 2022 vs. January 2021
Year-Over-Year January 2022 vs. January 2021
Month-Over-Month Summary
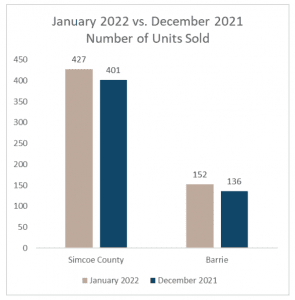
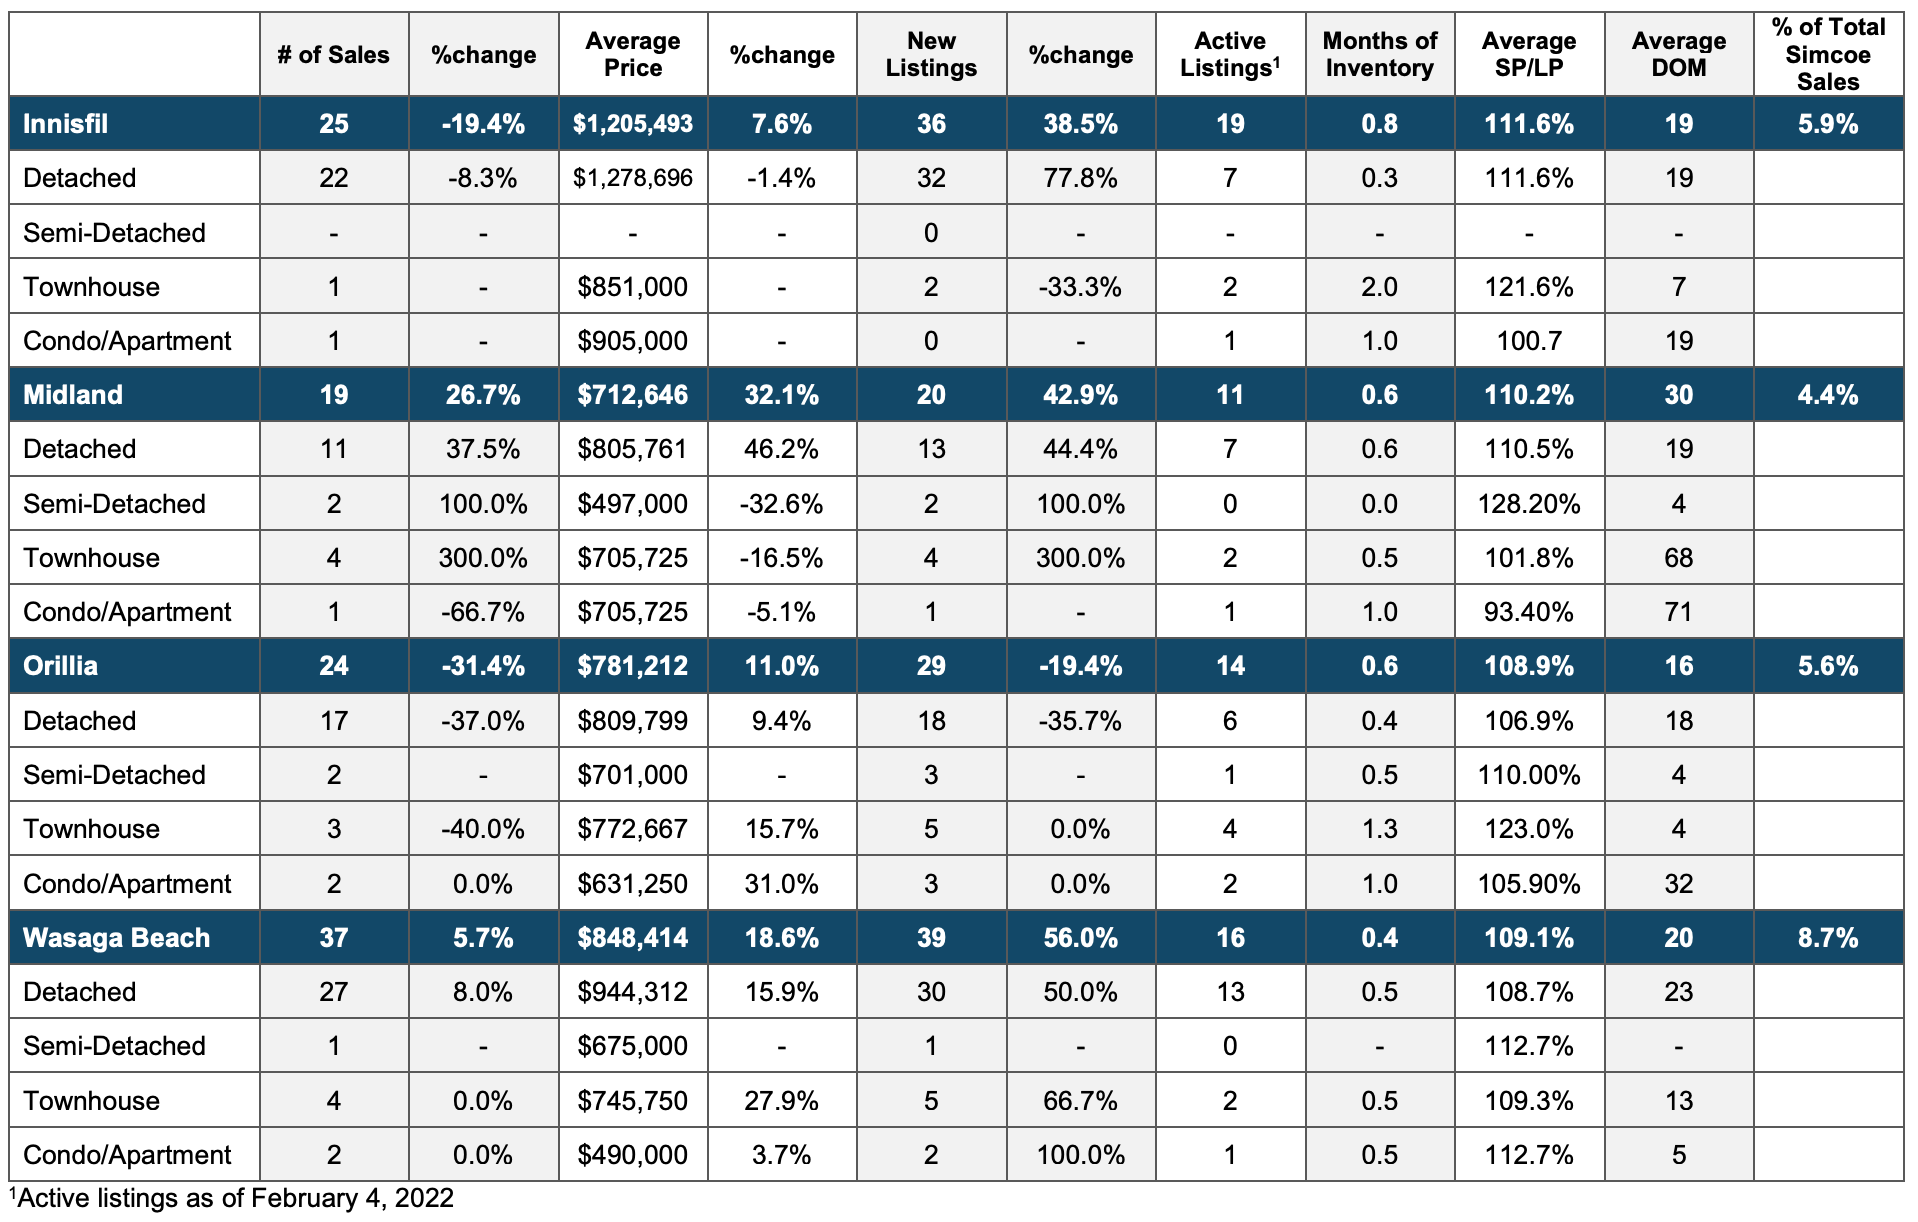
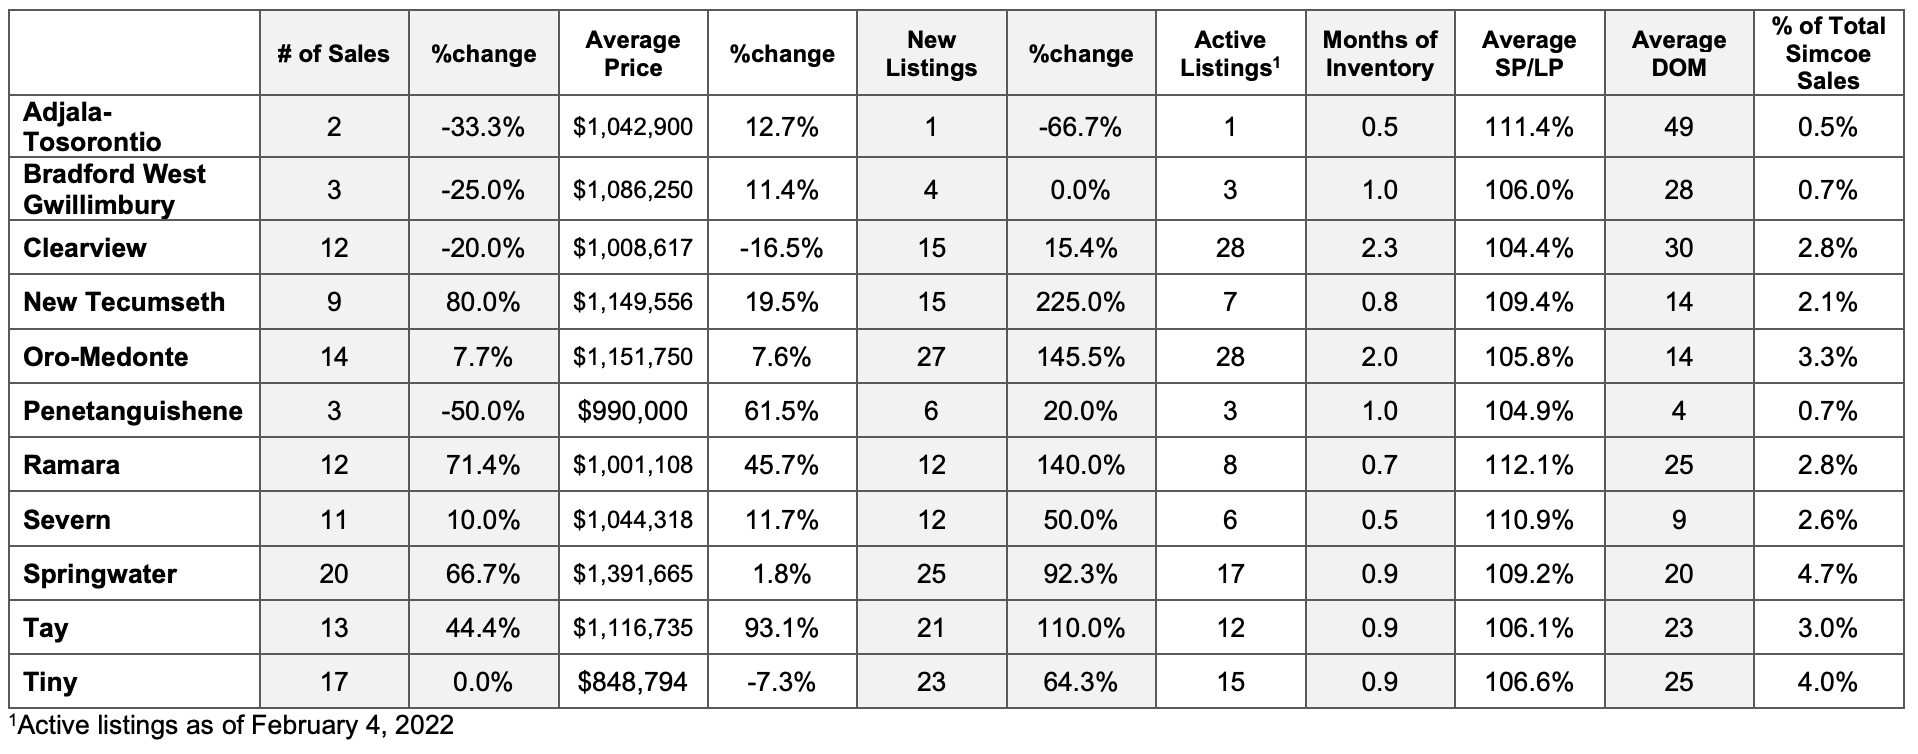
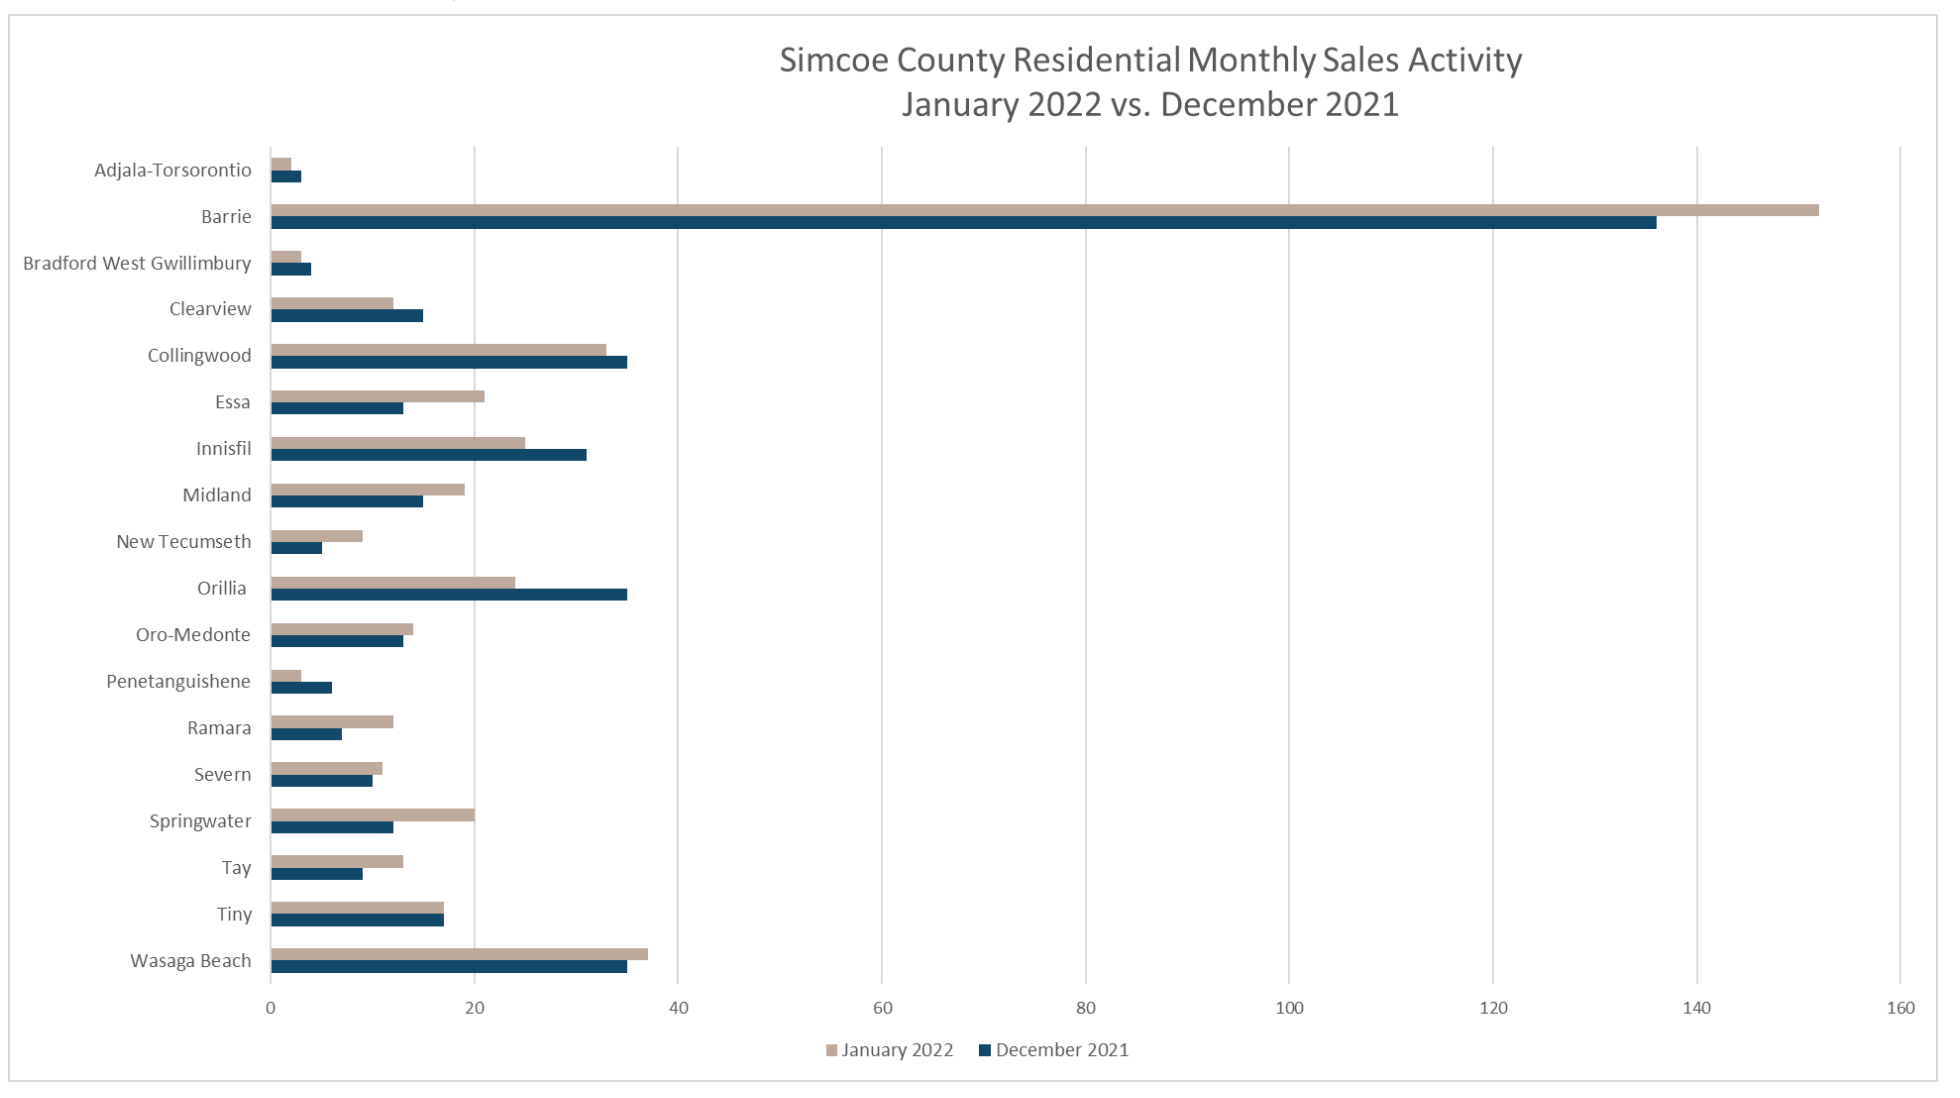
The January 2022 sales recorded through the MLS® System for the Barrie and District Association of REALTORS® (BDAR) region showed a month-over-month increase in the number of units sold in Simcoe County. The City of Barrie drove this growth with an 11.8% gain in the number of units sold. This growth comes after several months of declining sales activity.
427 residential units were sold in Simcoe County last month—a 6.5% increase from December 2021. During the same time a year ago (December 2020 to January 2021), there was an 8.2% decrease in the number of units sold.
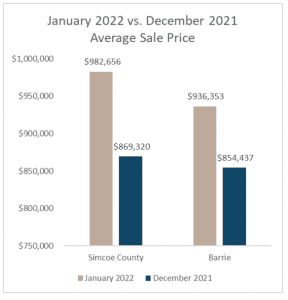
The average price of residential units sold last month in Simcoe County was $982,656—a 13.0% increase from December 2021. This growth was greater than the month-over-month change in average price a year ago (+5.7%).
152 units were sold last month within the City of Barrie, which was 11.8% more than the number of units sold the month prior. A year ago, the number of units sold between January and December decreased 10.6%.
The average price of units sold within Barrie during January 2022 was $936,353. This was 9.6% more than the average price during December 2021. In comparison, the average price of units sold between January 2021 and December 2020 increased 4.6%.
There was a large increase in new listings last month which prevents a further decline in overall inventory. New listings were up 63.0% in Simcoe County and 78.4% in Barrie from December 2021.
Month-Over-Month January 2022 vs. December 202
Month-Over-Month January 2022 vs. December 2021
Month-Over-Month January 2022 vs. December 2021
Month-Over-Month January 2022 vs. December 2021
Glossary of Terms
Number of Sales (# of Sales) – A count of all reported sales in a given time period.
Average Price – Mean sales price for all reported sales in a given time period.
New Listings – A count of the properties that have been newly listed on the MLS® system in a given time period.
Active Listings – A count of the available properties on the MLS® system at a point in time.
Months of Inventory – The number of active listings at the end of a given month, dived by the number of sales of that month.
Average Percent of List Price (Average SP/LP) – Percentage found when dividing a listing’s sales price by its list price, then taking the average for all sales in a time period.
Average Days on Market (Average DOM) – Average number of days between when a property is listed and when an offer is accepted in a given time period.
Percent of Total Simcoe County Sales (% of Total Simcoe Sales) – The number of sales in a municipality, dived by the total number of sales in Simcoe County in a given time period.

